Utica Shale Production in the 1st Quarter of 2017: A Closer Look
The Ohio Department of Natural Resources has now released the production data from the Utica shale for the first quarter of 2017. As always, we are going to give you a look at how the numbers compare to past quarters, past years, and how they break down among the various drillers who are active in Ohio and the counties where they are drilling. We also have the top 10 oil and gas wells detailed below.
PRODUCTION RATE COMPARISONS
First up, let's take a look at how the quarterly data compares from the 1st quarter of 2014 through the first quarter of 2017. As a reminder, all oil figures are 42-gallon barrels, and all gas production is measured in MCF:
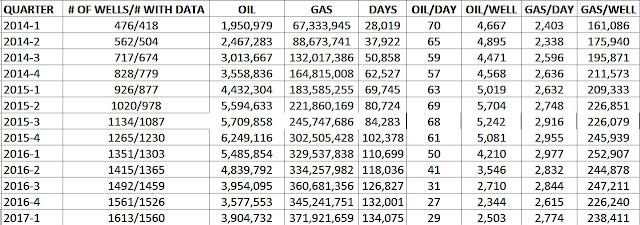
So, after four consecutive quarters of declining oil production (and six consecutive quarters of oil production rates falling), the first quarter of 2017 saw a quarter-to-quarter rise in total oil production and in oil per day in production as well as oil per well.
Gas production was back on the rise as well after there was a decrease in total production and a decline in production rates in the fourth quarter of 2016. In fact, the first quarter of 2017 saw a new high in shale gas production from the Utica.
 After year-to-year oil production saw a decline in 2016 from 2015, the first quarter results suggest that production could be on the decline for the year of 2017 as well. If oil production continues at its current pace, over 2,000,000 less barrels would be produced from the Utica shale in Ohio in 2017.
The gas production numbers are different. 2016 continued the trend of total production increasing year-over-year, and based on the first quarter results 2017 could very well be the same. If gas production continues at its current pace, there would be an increase of over 117,000,000 MCF this year. That would be the smallest increase in four years.
TOP PRODUCING WELLS
These are the top 10 oil producing wells from Q1 of 2017:

After Carroll County had 2 of the top 10 oil wells in Q4 of 2016, it falls off the list this quarter. Instead, there are 5 wells in Harrison County among the top 10. Guernsey has the other 5, after having 5 of the top 10 wells in the previous quarter. The Purple Hayes 1H well was the top oil-producing well for the second straight quarter, although the total barrels produced and the oil per day both dropped.
And here are the top 10 gas producing wells from Q1 of 2017:

There was quite a bit of change here from what was seen in Q4 of 2016. Jefferson County had none of the top 10 gas wells in the Q3 of 2016, then had 4 of the top 10 in Q4. Now it again had none of the top 10 gas wells in Q1 of 2017. Instead, Monroe County - which had none of the top 10 wells in the previous quarter - had the top 5 gas producing wells in this quarter.
COUNTY-BY-COUNTY
Yellow highlights mark the county the highest totals for any county during the quarter.

OPERATOR-BY-OPERATOR
Yellow highlights mark the county the highest totals for any operator during the quarter.

Click here to download the full report from the ODNR with all of the data.
Connect with us on Facebook and Twitter!
Follow @EnergyNewsBlog
PRODUCTION RATE COMPARISONS
First up, let's take a look at how the quarterly data compares from the 1st quarter of 2014 through the first quarter of 2017. As a reminder, all oil figures are 42-gallon barrels, and all gas production is measured in MCF:

So, after four consecutive quarters of declining oil production (and six consecutive quarters of oil production rates falling), the first quarter of 2017 saw a quarter-to-quarter rise in total oil production and in oil per day in production as well as oil per well.
Gas production was back on the rise as well after there was a decrease in total production and a decline in production rates in the fourth quarter of 2016. In fact, the first quarter of 2017 saw a new high in shale gas production from the Utica.

The gas production numbers are different. 2016 continued the trend of total production increasing year-over-year, and based on the first quarter results 2017 could very well be the same. If gas production continues at its current pace, there would be an increase of over 117,000,000 MCF this year. That would be the smallest increase in four years.
TOP PRODUCING WELLS
These are the top 10 oil producing wells from Q1 of 2017:

After Carroll County had 2 of the top 10 oil wells in Q4 of 2016, it falls off the list this quarter. Instead, there are 5 wells in Harrison County among the top 10. Guernsey has the other 5, after having 5 of the top 10 wells in the previous quarter. The Purple Hayes 1H well was the top oil-producing well for the second straight quarter, although the total barrels produced and the oil per day both dropped.
And here are the top 10 gas producing wells from Q1 of 2017:

There was quite a bit of change here from what was seen in Q4 of 2016. Jefferson County had none of the top 10 gas wells in the Q3 of 2016, then had 4 of the top 10 in Q4. Now it again had none of the top 10 gas wells in Q1 of 2017. Instead, Monroe County - which had none of the top 10 wells in the previous quarter - had the top 5 gas producing wells in this quarter.
COUNTY-BY-COUNTY
Yellow highlights mark the county the highest totals for any county during the quarter.

OPERATOR-BY-OPERATOR
Yellow highlights mark the county the highest totals for any operator during the quarter.

Click here to download the full report from the ODNR with all of the data.
Connect with us on Facebook and Twitter!
Follow @EnergyNewsBlog