Breaking Down the 2nd Quarter 2016 Utica Shale Production Data
The Ohio Department of Natural Resources has now released the production data from the Utica shale for the second quarter of 2016. As always, we are going to give you a look at how the numbers compare to past quarters, past years, and how they break down among the various drillers who are active in Ohio and the counties where they are drilling. We also have the top 10 oil and gas wells detailed below.
First up, let's take a look at how the quarterly data compares from the 1st quarter of 2014 through the second quarter of 2016. As a reminder, all oil figures are 42-gallon barrels, and all gas production is measured in MCF:
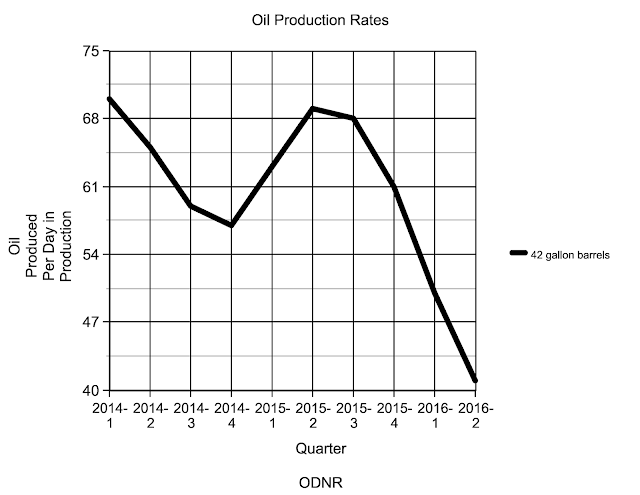
Continuing the trend noticed in the first quarter results, oil production continues to slide. This time gas production joined in. While overall gas production increased, rates per well and per day in production both dropped.
The drop in oil production is clearer to see in this graph:
Next we look at the yearly production from 2011 to 2015 and see how it compares to the production through two quarters of 2016:
Here are the top 10 oil-producing wells of the quarter:
And the top 10 gas-producing wells from the second quarter:
Here is a breakdown of the data by county:


And finally, the data broken down by operator:


Connect with us on Facebook and Twitter!
Follow @EnergyNewsBlog
First up, let's take a look at how the quarterly data compares from the 1st quarter of 2014 through the second quarter of 2016. As a reminder, all oil figures are 42-gallon barrels, and all gas production is measured in MCF:
| QUARTER | # OF WELLS/# WITH DATA | OIL | GAS | DAYS | OIL/DAY | OIL/WELL | GAS/DAY | GAS/WELL |
|---|---|---|---|---|---|---|---|---|
| 2014-1 | 476/418 | 1,950,979 | 67,333,945 | 28,019 | 70 | 4,667 | 2,403 | 161,086 |
| 2014-2 | 562/504 | 2,467,283 | 88,673,741 | 37,922 | 65 | 4,895 | 2,338 | 175,940 |
| 2014-3 | 717/674 | 3,013,667 | 132,017,386 | 50,858 | 59 | 4,471 | 2,596 | 195,871 |
| 2014-4 | 828/779 | 3,558,836 | 164,815,008 | 62,527 | 57 | 4,568 | 2,636 | 211,573 |
| 2015-1 | 926/877 | 4,432,304 | 183,585,255 | 69,745 | 63 | 5,019 | 2,632 | 209,333 |
| 2015-2 | 1020/978 | 5,594,633 | 221,860,169 | 80,724 | 69 | 5,704 | 2,748 | 226,851 |
| 2015-3 | 1134/1087 | 5,709,858 | 245,747,686 | 84,283 | 68 | 5,242 | 2,916 | 226,079 |
| 2015-4 | 1265/1230 | 6,249,116 | 302,505,428 | 102,378 | 61 | 5,081 | 2,955 | 245,939 |
| 2016-1 | 1351/1303 | 5,485,854 | 329,537,838 | 110,699 | 50 | 4,210 | 2,977 | 252,907 |
| 2016-2 | 1415/1365 | 4,839,792 | 334,257,982 | 118,036 | 41 | 3,546 | 2,832 | 244,878 |
Continuing the trend noticed in the first quarter results, oil production continues to slide. This time gas production joined in. While overall gas production increased, rates per well and per day in production both dropped.
The drop in oil production is clearer to see in this graph:

Next we look at the yearly production from 2011 to 2015 and see how it compares to the production through two quarters of 2016:
| YEAR | OIL | GAS |
|---|---|---|
| 2011 | 46,326 | 2,561,524 |
| 2012 | 635,874 | 12,831,292 |
| 2013 | 3,677,734 | 100,119,054 |
| 2014 | 10,990,765 | 452,840,080 |
| 2015 | 21,985,911 | 953,887,763 |
| 2016 YTD | 10,325,646 | 663,795,820 |
| TOTALS | 47,662,256 | 2,186,035,533 |
Here are the top 10 oil-producing wells of the quarter:
| OPERATOR | COUNTY | WELL NAME/NO. | OIL | OIL/DAY |
|---|---|---|---|---|
| ECLIPSE RESOURCES I LP | GUERNSEY | PURPLE HAYES 1H | 71072 | 1225 |
| ASCENT RESOURCES UTICA LLC | GUERNSEY | EGGLESTON WLS GR 2H | 50074 | 550 |
| ASCENT RESOURCES UTICA LLC | GUERNSEY | EGGLESTON WLS GR 4H | 49885 | 548 |
| CHESAPEAKE EXPLORATION LLC | HARRISON | DEMIS 12-12-6 1H | 41886 | 460 |
| CHESAPEAKE EXPLORATION LLC | HARRISON | WILLIAM DENOON 17-12-6 4H | 36408 | 400 |
| CHESAPEAKE EXPLORATION LLC | CARROLL | DELMAR 24-13-6 7H | 35903 | 408 |
| CHESAPEAKE EXPLORATION LLC | HARRISON | WILLIAM DENOON 17-12-6 2H | 35372 | 389 |
| CHESAPEAKE EXPLORATION LLC | HARRISON | WILLIAM DENOON 17-12-6 1H | 34173 | 376 |
| ECLIPSE RESOURCES I LP | GUERNSEY | FRITZ UNIT 7H | 34007 | 378 |
| ASCENT RESOURCES UTICA LLC | GUERNSEY | RED HILL FARM MDS GR 1H | 32601 | 358 |
And the top 10 gas-producing wells from the second quarter:
| OPERATOR | COUNTY | WELL NAME/NO. | GAS | GAS/DAY |
|---|---|---|---|---|
| CNX GAS COMPANY LLC | MONROE | BREWSTER SWITZ6DHSU | 1,615,882 | 17,757 |
| ECLIPSE RESOURCES I LP | MONROE | FUCHS A 4H | 1,593,854 | 17,709 |
| RICE DRILLING D LLC | BELMONT | MOHAWK WARRIOR 12H | 1,515,979 | 16,659 |
| CNX GAS COMPANY LLC | MONROE | BREWSTER SWITZ6FHSU | 1,495,736 | 16,437 |
| RICE DRILLING D LLC | BELMONT | MOHAWK WARRIOR 8H | 1,494,753 | 16,426 |
| ASCENT RESOURCES UTICA LLC | HARRISON | CRAVAT COAL SHC HR 2H | 1,465,010 | 16,099 |
| RICE DRILLING D LLC | BELMONT | MOHAWK WARRIOR 10H | 1,410,796 | 15,503 |
| ECLIPSE RESOURCES I LP | MONROE | DIETRICH C 4H | 1,395,538 | 15,506 |
| GULFPORT ENERGY CORP | BELMONT | EDGE 210126 2A | 1,382,144 | 15,530 |
| GULFPORT ENERGY CORP | BELMONT | EDGE 210021 1D | 1,379,785 | 15,503 |
Here is a breakdown of the data by county:
| COUNTY | # OF WELLS TOTAL | # OF WELLS PRODUCING | OIL | GAS | DAYS | OIL/WELL | OIL/DAY | GAS/WELL | GAS/DAY |
|---|---|---|---|---|---|---|---|---|---|
| Belmont | 198 | 177 | 54,797 | 103,209,082 | 14,251 | 310 | 4 | 583,102 | 7,242 |
| Carroll | 432 | 430 | 1,123,140 | 51,996,103 | 38,709 | 2,612 | 29 | 120,921 | 1,343 |
| Columbiana | 66 | 60 | 22,473 | 9,303,523 | 5,445 | 375 | 4 | 155,059 | 1,709 |
| Coshocton | 1 | 1 | 171 | 10,119 | 91 | 171 | 2 | 10,119 | 111 |
| Guernsey | 117 | 116 | 1,287,443 | 12,036,242 | 9,734 | 11,099 | 132 | 103,761 | 1,237 |
| Harrison | 277 | 273 | 1,836,493 | 50,902,259 | 23,451 | 6,727 | 78 | 186,455 | 2,171 |
| Jefferson | 24 | 21 | 117 | 7,591,409 | 1835 | 6 | 0 | 361,496 | 4,137 |
| Mahoning | 13 | 11 | 2,471 | 692,546 | 769 | 225 | 3 | 62,959 | 901 |
| Monroe | 142 | 139 | 71,748 | 70,284,368 | 12,067 | 516 | 6 | 505,643 | 5,825 |
| Morgan | 2 | 2 | 5,642 | 74,348 | 182 | 2,821 | 31 | 37,174 | 409 |
| Muskingum | 1 | 1 | 374 | 12,181 | 91 | 374 | 4 | 12,181 | 134 |
| Noble | 116 | 116 | 409,057 | 27,152,857 | 10,188 | 3,526 | 40 | 234,076 | 2,665 |
| Portage | 4 | 1 | 0 | 2,190 | 16 | 0 | 0 | 2,190 | 137 |
| Stark | 2 | 2 | 826 | 40,456 | 181 | 413 | 5 | 20,228 | 224 |
| Trumbull | 4 | 4 | 1,385 | 95,270 | 280 | 346 | 5 | 23,818 | 340 |
| Tuscarawas | 7 | 6 | 19,036 | 141,408 | 296 | 3,173 | 64 | 23,568 | 478 |
| Washington | 9 | 5 | 4,619 | 713,621 | 450 | 924 | 10 | 142,652 | 1,585 |


And finally, the data broken down by operator:
| OPERATOR | TOTAL # OF WELLS | # OF PRODUCING WELLS | OIL | GAS | DAYS | OIL/WELL | OIL/DAY | GAS/WELL | GAS/DAY |
|---|---|---|---|---|---|---|---|---|---|
| Antero Resources Corporation | 138 | 137 | 289,118 | 53,536,464 | 12,234 | 2,110 | 24 | 390,777 | 4,376 |
| Artex Oil Company | 6 | 6 | 3,550 | 125,800 | 546 | 592 | 7 | 20,967 | 230 |
| Ascent Resources Utica LLC | 87 | 87 | 914,267 | 26,526,375 | 7,182 | 10,509 | 127 | 304,901 | 3,693 |
| Atlas Noble LLC | 12 | 12 | 14,622 | 1,504,022 | 1,080 | 1,219 | 14 | 125,335 | 1,393 |
| Carrizo (Utica) LLC | 4 | 3 | 55,207 | 247,417 | 212 | 18,402 | 260 | 82,472 | 1,167 |
| Chesapeake Appalachia LLC | 6 | 4 | 19 | 1,101,172 | 364 | 5 | - | 275,293 | 3,025 |
| Chesapeake Exploration LLC | 631 | 620 | 2,219,397 | 86,688,862 | 55,030 | 3,580 | 40 | 139,821 | 1,575 |
| Chevron Appalachia LLC | 8 | 6 | 61,526 | 386,317 | 546 | 10,254 | 113 | 64,386 | 708 |
| CNX Gas Company LLC | 42 | 41 | 142,471 | 10,584,373 | 3,003 | 3,475 | 47 | 258,155 | 3,525 |
| Eclipse Resources I LP | 55 | 55 | 442,187 | 14,073,151 | 4,918 | 8,040 | 90 | 255,875 | 2,862 |
| EM Energy Ohio LLC | 2 | 1 | - | 758,896 | 83 | - | - | 758,896 | 9,143 |
| Enervest Operating L | 5 | 5 | 3,470 | 60,714 | 455 | 694 | 8 | 12,143 | 133 |
| EQT Production Company | 6 | 6 | 8,699 | 96,387 | 531 | 1,450 | 16 | 16,065 | 182 |
| Gulfport Energy Corporation | 187 | 187 | 248,064 | 71,959,258 | 15,719 | 1,327 | 16 | 384,809 | 4,578 |
| Halcon Operating Company Inc | 5 | 5 | 2,053 | 119,371 | 370 | 411 | 6 | 23,874 | 323 |
| Hess Ohio Developments LLC | 59 | 56 | 135,631 | 19,554,180 | 4,508 | 2,422 | 30 | 349,182 | 4,338 |
| Hilcorp Energy Company | 10 | 9 | - | 1,500,361 | 784 | - | - | 166,707 | 1,914 |
| Mountaineer Keystone LLC | 2 | - | - | - | - | - | - | - | - |
| NGO Development Corp. | 1 | 1 | 171 | 10,119 | 91 | 171 | 2 | 10,119 | 111 |
| PDC Energy Inc | 23 | 23 | 115,218 | 792,938 | 2,088 | 5,009 | 55 | 34,476 | 380 |
| Protégé Energy III LLC | 1 | 1 | 2,762 | 556,267 | 91 | 2,762 | 30 | 556,267 | 6,113 |
| R E Gas Development LLC | 38 | 38 | 133,201 | 3,194,608 | 3,152 | 3,505 | 42 | 84,069 | 1,014 |
| Rice Drilling D LLC | 37 | 25 | - | 23,311,713 | 2,039 | - | - | 932,469 | 11,433 |
| Statoil USA Onshore Prop Inc | 8 | 6 | 27,915 | 490,370 | 546 | 4,653 | 51 | 81,728 | 898 |
| Triad Hunter LLC | 12 | 8 | 18,782 | 1,882,924 | 736 | 2,348 | 26 | 235,366 | 2,558 |
| XTO Energy Inc. | 30 | 23 | 1,462 | 15,195,923 | 1,728 | 64 | 1 | 660,692 | 8,794 |


Connect with us on Facebook and Twitter!
Follow @EnergyNewsBlog