EIA Looks at Increasing Utica Shale Focus on Natural Gas Production
From the Energy Information Administration:


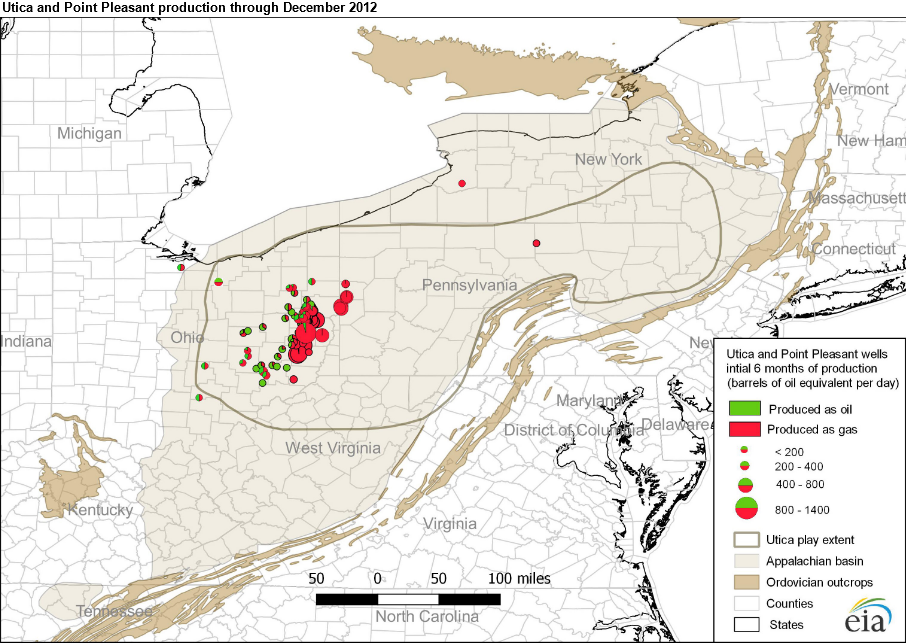
Source: U.S. Energy Information Administration based on DrillingInfo Inc., Appalachian Oil and Natural Gas Research Consortium, and U.S. Geological Survey
Note: EIA calculates the daily production rate for each well using the initial six contiguous months of liquid and gas production expressed in barrels of oil equivalent per day. Click to enlarge.
Only 104 wells in the Utica play produced oil or natural gas in 2012, with most wells coming into production in 2013 or later, as shown on the maps above. Although the Utica play produces a mixture of oil and natural gas, recent development in the Utica has focused on natural gas. The rapid growth in Utica/Point Pleasant natural gas production since 2012 is attributable to increases in drilling efficiency, proximity to markets, improvements in business processes, resource targeting in stacked plays, and the lengthening of horizontal laterals. Relatively low oil prices and expansions in natural gas infrastructure make the natural gas-rich portions of the reservoir more desirable for development, and therefore, increasingly the target for operators.
The relative portions of natural gas and oil in a particular formation can be represented by mapping initial gas-to-oil ratios (GORs). GORs characterize the ratio of natural gas to oil produced from a well, expressed in standard cubic feet per barrel—scf/b. The distribution of oil and natural gas in a formation is partially controlled by the thermal maturity of a rock, which is an indication of potential hydrocarbon generation.
Crude oil and natural gas are produced by the heating of organic materials (i.e., kerogen) found in some rocks over long periods of time. When organic-rich rocks, usually shales, are buried, they are exposed to increasing temperatures and pressures. Heating causes the organic matter to change into the waxy material known as kerogen, then into oil, and finally into natural gas as the temperature further increases.

Source: U.S. Energy Information Administration based on DrillingInfo Inc., Appalachian Oil and Natural Gas Research Consortium, U.S. Geological Survey, and various state agencies
Note: EIA calculates GOR for each well using the initial six contiguous months of liquid and gas production. Click to enlarge.
The temperature ranges conducive to converting organic material to oil and natural gas are referred to as the oil window and the gas window, respectively. The oil window typically occurs at temperatures between 60 degrees and 120 degrees Celsius, while the natural gas window occurs between 100 degrees and 200 degrees Celsius. Although this temperature range is found at different depths below the surface throughout the world, a typical depth for the oil window in the Utica play is 4,000 feet to 8,000 feet, and the corresponding gas window is 7,000 feet to 12,000 feet.
In the map above, natural gas-rich wells in the Utica play are mostly located in the eastern portion of the play, and oil-rich wells are typically located in the western portion. The distribution of initial GORs generally corresponds to the depth of the reservoir. Deeper wells (up to 13,000 feet) in the eastern portion have higher initial GORs (greater than 10,000 scf/b) and produce mostly natural gas, while the shallower wells to the west have lower initial GORs (less than 10,000 scf/b) and produce mostly oil.
Recent updates to EIA's maps and geologic information for the Utica play help to describe the formations' production, gas-to-oil ratios, and other geologic characteristics. This information provides a better understanding of recent production within the context of key geologic parameters.
Principal contributors: Olga Popova, Gary Long, Chris Peterson
Connect with us on Facebook and Twitter!
Follow @EnergyNewsBlog
Source: U.S. Energy Information Administration and DrillingInfo Inc., June 2016
Note: The two vertical axes are scaled to present oil and natural gas production in roughly energy-equivalent terms.
Note: The two vertical axes are scaled to present oil and natural gas production in roughly energy-equivalent terms.
Production of oil and natural gas in the Appalachian Basin's Utica play—which includes both the Utica and Point Pleasant formations—has increased significantly since 2012. Monthly natural gas production from Utica wells increased from 0.1 billion cubic feet per day (Bcf/d) in December 2012 to more than 3.5 Bcf/d in June 2016. Oil production increased from 4,400 barrels per day (b/d) to nearly 76,000 b/d over the same period.
Source: U.S. Energy Information Administration based on DrillingInfo Inc., Appalachian Oil and Natural Gas Research Consortium, and U.S. Geological Survey
Note: EIA calculates the daily production rate for each well using the initial six contiguous months of liquid and gas production expressed in barrels of oil equivalent per day. Click to enlarge.
Only 104 wells in the Utica play produced oil or natural gas in 2012, with most wells coming into production in 2013 or later, as shown on the maps above. Although the Utica play produces a mixture of oil and natural gas, recent development in the Utica has focused on natural gas. The rapid growth in Utica/Point Pleasant natural gas production since 2012 is attributable to increases in drilling efficiency, proximity to markets, improvements in business processes, resource targeting in stacked plays, and the lengthening of horizontal laterals. Relatively low oil prices and expansions in natural gas infrastructure make the natural gas-rich portions of the reservoir more desirable for development, and therefore, increasingly the target for operators.
The relative portions of natural gas and oil in a particular formation can be represented by mapping initial gas-to-oil ratios (GORs). GORs characterize the ratio of natural gas to oil produced from a well, expressed in standard cubic feet per barrel—scf/b. The distribution of oil and natural gas in a formation is partially controlled by the thermal maturity of a rock, which is an indication of potential hydrocarbon generation.
Crude oil and natural gas are produced by the heating of organic materials (i.e., kerogen) found in some rocks over long periods of time. When organic-rich rocks, usually shales, are buried, they are exposed to increasing temperatures and pressures. Heating causes the organic matter to change into the waxy material known as kerogen, then into oil, and finally into natural gas as the temperature further increases.
Source: U.S. Energy Information Administration based on DrillingInfo Inc., Appalachian Oil and Natural Gas Research Consortium, U.S. Geological Survey, and various state agencies
Note: EIA calculates GOR for each well using the initial six contiguous months of liquid and gas production. Click to enlarge.
The temperature ranges conducive to converting organic material to oil and natural gas are referred to as the oil window and the gas window, respectively. The oil window typically occurs at temperatures between 60 degrees and 120 degrees Celsius, while the natural gas window occurs between 100 degrees and 200 degrees Celsius. Although this temperature range is found at different depths below the surface throughout the world, a typical depth for the oil window in the Utica play is 4,000 feet to 8,000 feet, and the corresponding gas window is 7,000 feet to 12,000 feet.
In the map above, natural gas-rich wells in the Utica play are mostly located in the eastern portion of the play, and oil-rich wells are typically located in the western portion. The distribution of initial GORs generally corresponds to the depth of the reservoir. Deeper wells (up to 13,000 feet) in the eastern portion have higher initial GORs (greater than 10,000 scf/b) and produce mostly natural gas, while the shallower wells to the west have lower initial GORs (less than 10,000 scf/b) and produce mostly oil.
Recent updates to EIA's maps and geologic information for the Utica play help to describe the formations' production, gas-to-oil ratios, and other geologic characteristics. This information provides a better understanding of recent production within the context of key geologic parameters.
Principal contributors: Olga Popova, Gary Long, Chris Peterson
Connect with us on Facebook and Twitter!
Follow @EnergyNewsBlog


