Digging Deep Into the 3rd Quarter 2018 Utica Shale Production Figures
The Ohio Department of Natural Resources has now released the production data from the Utica shale for the third quarter of 2018. As always, we are going to give you a look at how the numbers compare to past quarters, past years, and how they break down among the various drillers who are active in Ohio and the counties where they are drilling. We'll look at where the production numbers would end up for 2018 if they continue at the same pace as they have had through the first three quarters. We also have the top 10 oil and gas wells detailed below.
PRODUCTION RATE COMPARISONS
First up, let's take a look at how the quarterly data compares from the first quarter of 2014 (which is when the ODNR began reporting quarterly data rather than one yearly report) through the third quarter of 2018. As a reminder, all oil figures are 42-gallon barrels, and all gas production is measured in MCF:
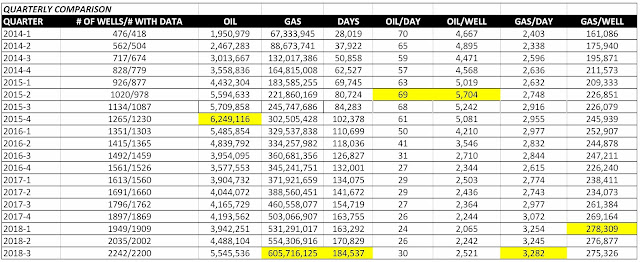
Oil production continues its rebound in the third quarter. The total output is the most we've seen since the first quarter of 2016, while the rate of oil per day in production hit 30 for the first time since the third quarter of 2016. At the same time, the rate is still far off from the peak of 69 barrels per day in production that was reached in quarter two of 2015.
After seeing a slight decline in quarter two, gas production rates bounced back in the third quarter in terms of how much gas was produced per day in production. The rate per well fell for the second straight quarter, though. Still, overall gas produced hit another new peak.
The next table shows the production comparison year-over-year.

The stronger oil numbers of the past two quarters have put 2018 on pace to end the two year decline in total oil production and in fact post the second-highest yearly production number of the past eight years. Meanwhile, the gas production from the first three quarters of this year is just a little bit short of matching the entire year's total from 2017 and will certainly set a new peak when the final production numbers are released for quarter four of 2018.

Here are the top 10 gas-producing wells from the quarter:

Eclipse Resources manages to claim the top spot on this list as well, but the rest belongs to Ascent Resources. Jefferson County has emerged as a top gas producer, so its appearance in 6 of the top 10 spots is no surprise.

Guernsey County continues to produce by far the most oil despite having only sixth-most total wells in production. On the quarter four report, Carroll County will likely surrender the top spot in terms of total wells in production to Belmont County after having been the leader in wells since the beginning of the Utica shale boom.

PRODUCTION RATE COMPARISONS
First up, let's take a look at how the quarterly data compares from the first quarter of 2014 (which is when the ODNR began reporting quarterly data rather than one yearly report) through the third quarter of 2018. As a reminder, all oil figures are 42-gallon barrels, and all gas production is measured in MCF:

After seeing a slight decline in quarter two, gas production rates bounced back in the third quarter in terms of how much gas was produced per day in production. The rate per well fell for the second straight quarter, though. Still, overall gas produced hit another new peak.

TOP PRODUCING WELLS
Here are the top 10 oil-producing wells in quarter one of 2018:

Eclipse Resources remains the Utica leader as far as oil production goes, with the top 6 wells of the quarter. After Harrison County had a couple of the top 10 wells in previous quarters, this time around it's all Guernsey County, which has clearly distinguished itself as the top oil location in the Utica shale.
Here are the top 10 gas-producing wells from the quarter:

Eclipse Resources manages to claim the top spot on this list as well, but the rest belongs to Ascent Resources. Jefferson County has emerged as a top gas producer, so its appearance in 6 of the top 10 spots is no surprise.
COUNTY-BY-COUNTY
Here is the production data broken down by county:
Here is the production data broken down by county:

Guernsey County continues to produce by far the most oil despite having only sixth-most total wells in production. On the quarter four report, Carroll County will likely surrender the top spot in terms of total wells in production to Belmont County after having been the leader in wells since the beginning of the Utica shale boom.
OPERATOR-BY-OPERATOR
And here are the results broken down by operator:
And here are the results broken down by operator:

Eclipse Resources produced only 400,000 less barrels of oil than the leader in total oil production, Ascent Resources, despite Ascent having almost 3 times as many wells in production. Meanwhile, Ascent's total gas production dwarfs every other driller's output.
We hope you enjoyed this breakdown of the data. You can view the spreadsheet from the ODNR containing all of the production data by clicking here.
We hope you enjoyed this breakdown of the data. You can view the spreadsheet from the ODNR containing all of the production data by clicking here.