EID Report: Sales Tax Revenues in Ohio Shale Counties Outpace State Averages
by Jackie Stewart, Energy in Depth

Connect with us on Facebook and Twitter!
Follow @EnergyNewsBlog
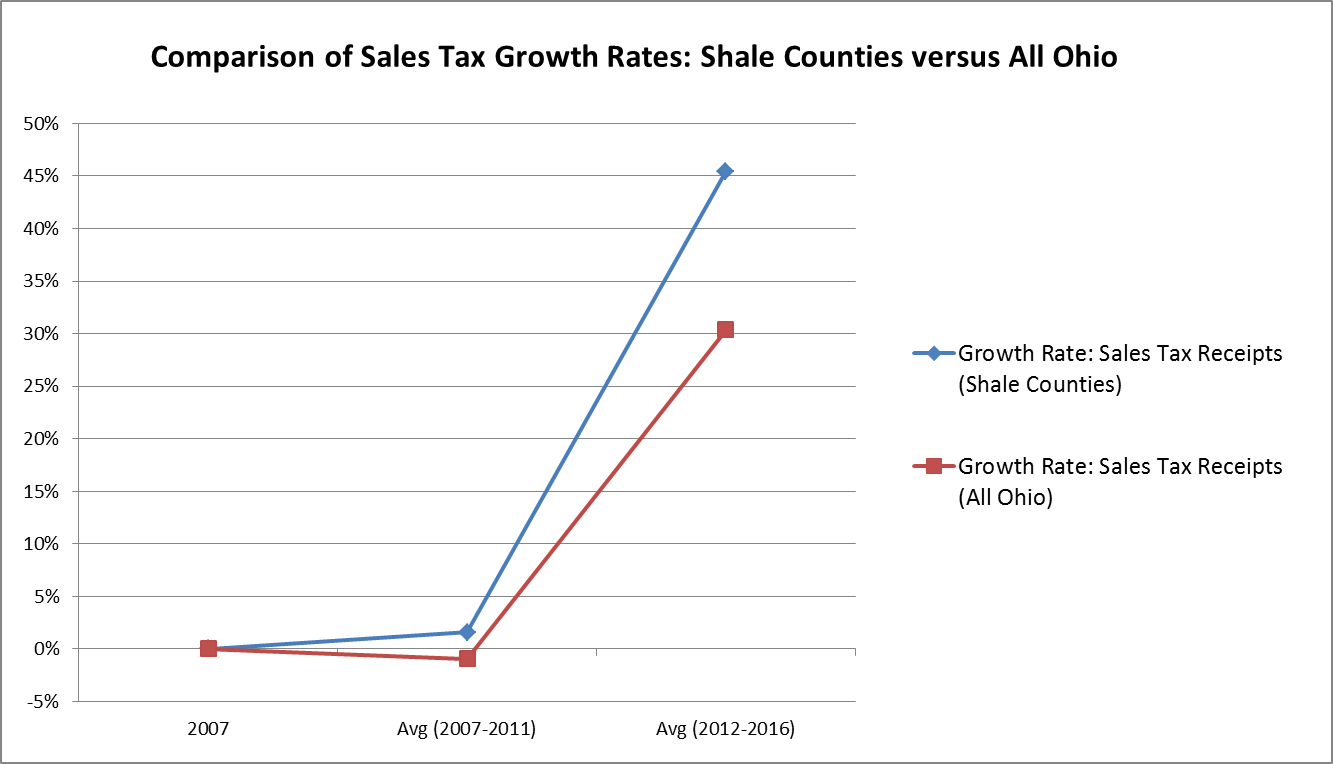
New EID research using data obtained from the Ohio Department of Taxation’s sales tax distribution website shows that from 2012 to 2016 the aggregate Ohio sales and use tax grew by 45 percent in eight core Utica Shale producing counties, outpacing the sales tax growth rate of Ohio’s 80 other counties by 15 percent. With more than $50 billion spent in Ohio by the oil and gas industry, it’s not surprising that Ohio’s economy continues to show significant and tangible signs of growth.
Methodology of Sales Tax & Use Revenue Analysis
For this analysis, EID analyzed the county apportionment of the state’s eight top oil and natural gas producing counties — Belmont, Carroll, Columbiana, Guernsey, Harrison, Jefferson, Monroe and Noble — for fiscal years 2007-2016. The average sales tax revenues for these eight counties were grouped into two categories: “before shale” (FY 2007-2011) and “after shale” (FY 2012-2016).
According to the Ohio Department of Taxation’s sales tax distribution website,
“Counties and regional transit authorities may levy additional sales and use taxes. The local share is returned to the counties and regional transit authorities in the second month after the month the return is filed.”
In other words, the sales tax allocation that the state pays to each county is only a small fraction of the overall sales tax actually paid by consumers. In fact, the state of Ohio keeps the majority of sales tax revenues for its general fund. Here’s an example of how that works:
- A business in Carroll County sells an item for $100.00 plus $6.75 in sales tax, the consumer is charged $106.75. The business collecting the sales tax sends that $6.75 to the state of Ohio.
- Out of that $6.75, the state keeps $5.75 and returns $1.00 to the county where the business is operating.
The reason this is important to note is because the 45 percent boost in sales tax revenue found in these top shale counties is in fact a boost to the entire state, because the state of Ohio keeps the vast majority of the tax collected, with only a small fraction returned to individual counties.
While the 45 percent aggregate growth is certainly impressive, some individual counties, such as Harrison County and Monroe County, really stood out particularly on a per capita basis.
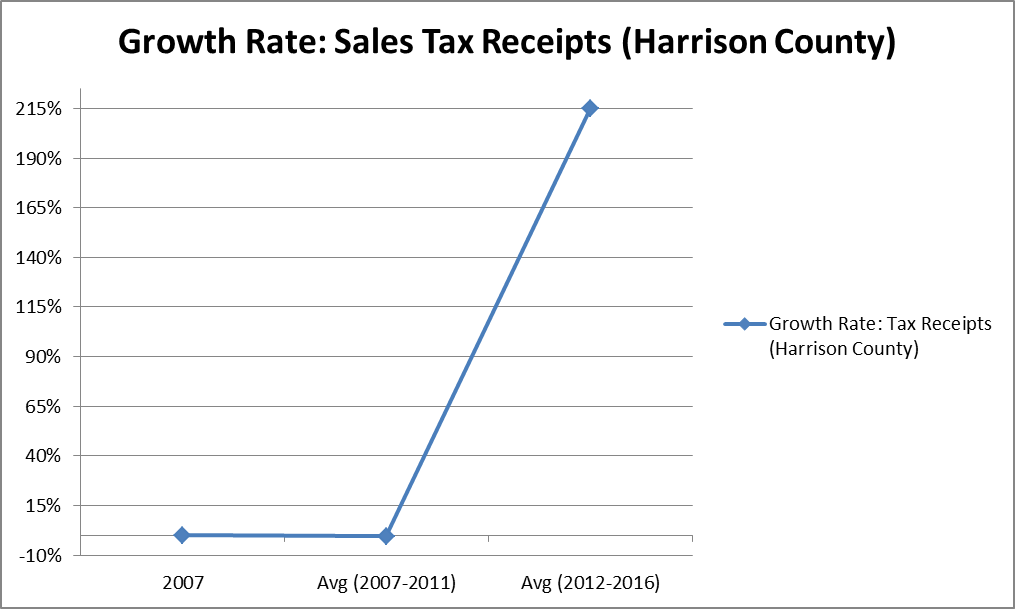
Utica Shale County in Focus: Harrison Co. Sales Tax Revenue Increases 215 Percent
From FY 2007-FY 2011 (before shale) Harrison County averaged about $1.3 million per year in sales tax revenue. With a population of 15,450, the county’s per capita revenue (on average) was about $88.
Harrison County has consistently been a top producing natural gas county statewide ever since its first horizontal well went into production in 2011. Even so, the real economic impact to the sales tax revenue is more likely driven by the bricks and mortar investment by midstream companies. The surge of economic activity in the county brought on by significant investments made by companies such as MarkWest. So how does that impact sales tax revenues?
Well, Harrison County went from $1.3 million per year in sales tax revenues before shale to (on average) $4.2 million per year from FY 2012-FY 2016. This shows the oil and gas industry has grown those tax coffers by $2.6 million per year (215 percent) taking the per capita revenue from $88 up to $274!
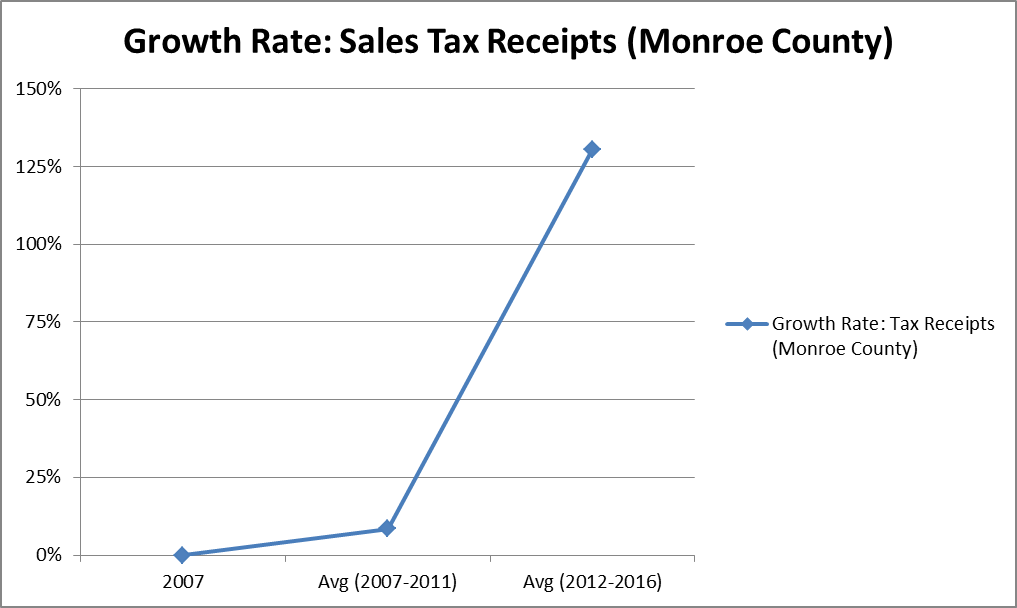
Utica Shale County in Focus: Monroe Co. Tax Revenue Increases 130 Percent
Monroe County continues to show the best dry gas wells coming out of the Utica Shale. Drilling activities have consistently been on the rise and there’s also been a flurry of pipeline activities. There is also now end use investment, such as a proposed natural gas power plant and natural gas liquids (NGLs) storage facility.
A few years ago, after losing the county’s largest employer county budgets were in dire straits. Like so many counties along the Ohio River struggling from coal and steel facility closures, Monroe County was only receiving about $1.4 million in sales tax revenues from FY 2007-FY2011, with a per capita rate of $102. Since 2011, or “after shale,” Monroe County has realized an annual average of $3.4 million in sales tax revenue , representing a boost of about $2 million per year, raising the per capita rate to $235. This represents an aggregate growth of 130 percent!
Conclusion
We can deduce a few important trends from the data and analysis on sales tax revenue collections and trends. First, there’s a clear connection between areas where shale production is occurring and economic growth for that region. Second, and tiered off the first point, production of natural gas is leading to tertiary investment, such as midstream (pipelines, processing of NGLs, etc.), and end use applications and storage (such as natural gas power plants, NGLs storage, and manufacturing). For example, as EID recently reported, thanks to fracking, a steel manufacturing plant recently reopened after being closed for eight years.
And more importantly, we are just getting started. Imagine what will happen next with Shell’s plans to continue to build out a world-scale petrochemical plant and the potential of a second project announcement by PTT Global Chemical. In short, it’s simply impossible to deny that production of shale from the Appalachian Basin is leading to long-term and tangible growth trends along the Ohio River.
Connect with us on Facebook and Twitter!
Follow @EnergyNewsBlog


