Harvard Study Says Methane Leak Rates in U.S. Are Higher than EPA Reports
A study from Harvard researchers concludes that methane emissions are on the rise despite EPA findings to the contrary. Here is the abstract from the study:
Connect with us on Facebook and Twitter!
Follow @EnergyNewsBlog
The global burden of atmospheric methane has been increasing over the past decade but the causes are not well understood. National inventory estimates from the US Environmental Protection Agency (EPA) indicate no significant trend in US anthropogenic methane emissions from 2002 to present. Here we use satellite retrievals and surface observations of atmospheric methane to suggest that US methane emissions have increased by more than 30% over the 2002–2014 period. The trend is largest in the central part of the country but we cannot readily attribute it to any specific source type. This large increase in US methane emissions could account for 30–60% of the global growth of atmospheric methane seen in the past decade.Despite the researchers' statement that the increased methane emissions cannot be attributed to any specific source type, anti-drillers were quick to assume that shale drilling is the culprit. For example, this article from ThinkProgress:
While this new study doesn’t attribute a specific source to the remarkable 30 percent increase in U.S. methane emissions from 2002–2014, many other studies have identified the source of those emissions as leakage of methane from the natural gas production and delivery system.
The central problem for the climate is that natural gas is mostly methane (CH4), a super-potent greenhouse gas, which traps 86 times as much heat as CO2 over a 20-year period. That’s why manystudies find that even a very small leakage rate can have a large climate impact — enough to gut the entire benefit of switching from coal-fired power to gas for a long, long time.Industry site Energy in Depth was quick to respond to such claims:
Indeed, as the following graphic from the report illustrates, there is no correlation between existing U.S. shale plays and areas the researchers found increased methane emissions. In fact, the graphic shows methane emissions are actually greater in many areas with no shale development and/or little to no oil and gas production.
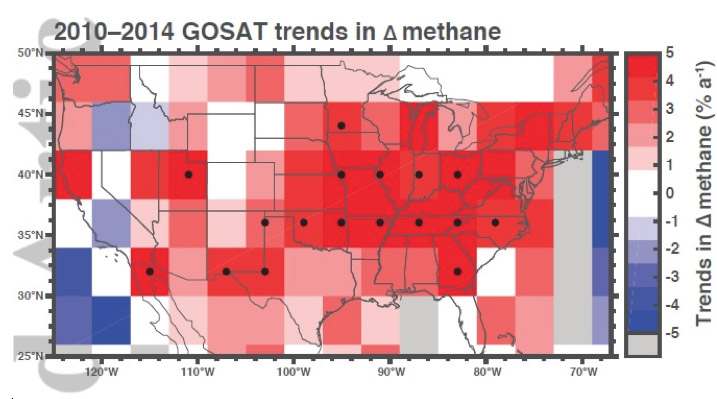
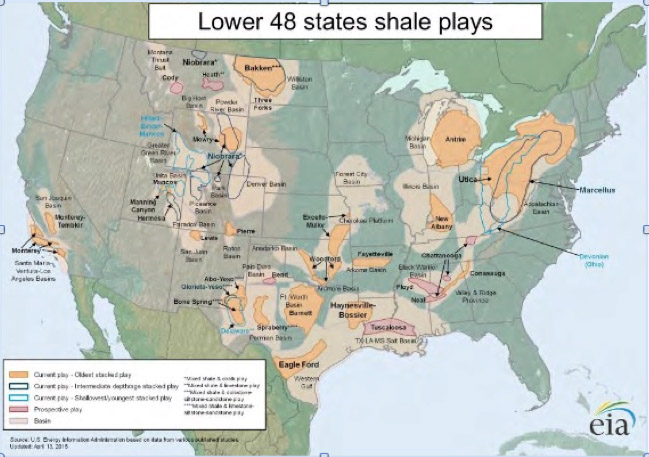
Many of the areas highlighted in red to illustrate increased methane emissions in the first graphic – including Illinois, south-central Pennsylvania, northern and southern California, New York state, North Carolina and Nebraska – have no shale development. Other states highlighted in red such as Iowa, Minnesota, Wisconsin, Missouri and Georgia have no oil and gas production at all, yet have seen huge spikes in methane emissions, according to the study.
The researchers admit that their method of using satellite retrievals (along with a single surface observation in Oklahoma) to compile their data inhibited them from determining specific sources of methane emissions.
Connect with us on Facebook and Twitter!
Follow @EnergyNewsBlog


